San Antonio Real Estate Market Update — September


San Antonio listings are sitting longer than they did a year ago — 68 days on market in August 2026 — and that slow grind is exactly where wholesale deals get made. If you're sourcing in Bexar County right now, the market is handing you more motivated sellers than it did last spring.
Key Takeaways
- San Antonio's median days on market hit 68 days in August 2026, matching August 2025 and up from a spring low of 53 days in April.
- Active listings climbed to 14,325 in August 2026 — the highest reading in the past year.
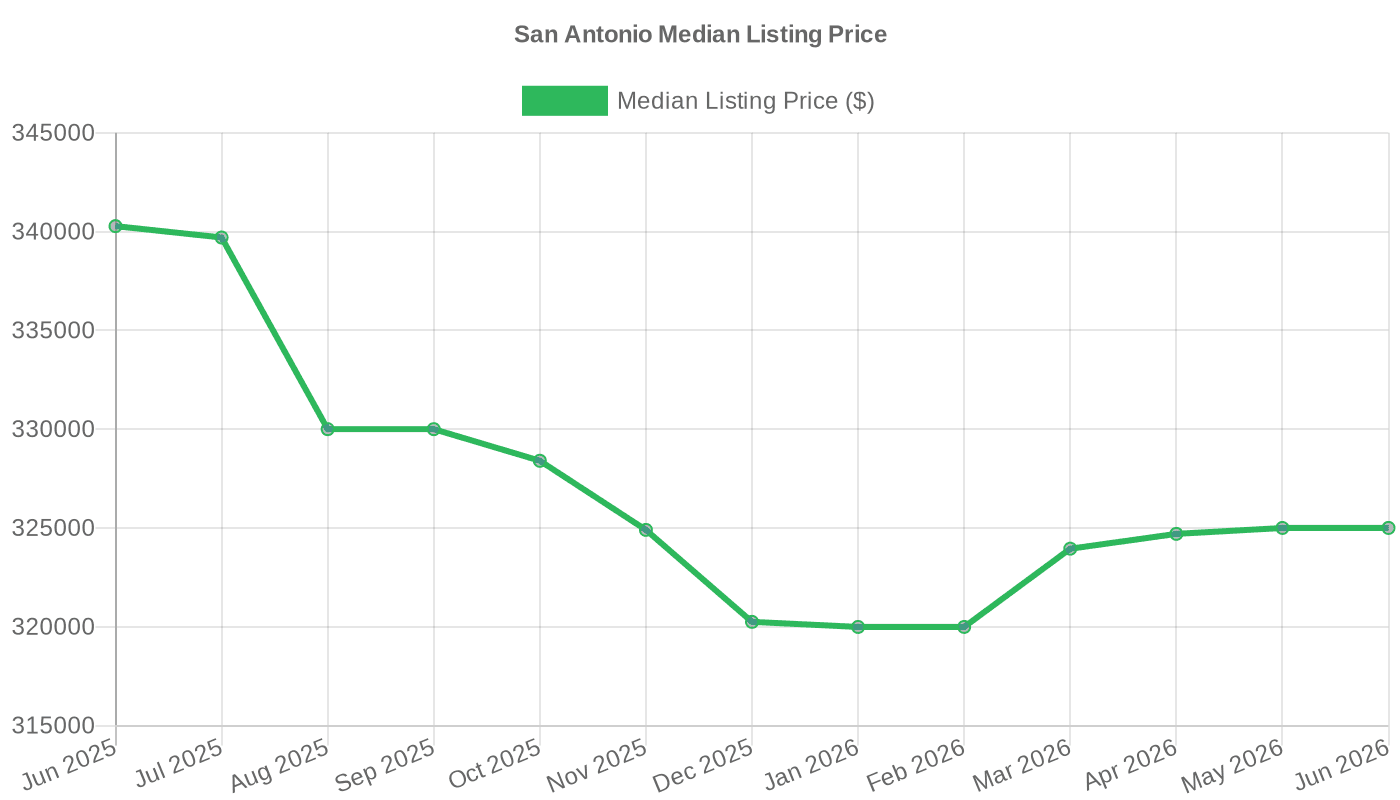
- The median listing price slipped to $324,000, down from $330,000 a year earlier.
- The 30-year fixed mortgage rate rose to 7.03% by September 24, 2026, which pressures buyer budgets and stretches time on market.
- Nationally, median days on market was 60 days in August 2026 — San Antonio is running slightly slower than the country as a whole.
What is the San Antonio real estate market doing right now?
The San Antonio real estate market is cooling into a slower, more balanced fall — homes take longer to sell, inventory is building, and list prices are drifting down. That combination is the classic setup wholesalers wait for.
Here's the snapshot as of August 2026:
- Median days on market: 68 days
- Active listings: 14,325
- Median listing price: $324,000
Compare that to a year earlier, when the median days on market was also 68 days but active listings were only 13,794. Inventory is up roughly 4% year over year while prices have eased. More homes, softer prices, longer waits — that's a buyer's-leaning market, and it's a seller-motivation market.
Why the spring looked so different
Go back to April 2026 and the picture flipped. Median days on market dropped to just 53 days — the fastest reading of the past year. Sellers had momentum, buyers were competing, and deals moved quickly.
By August, that number climbed back to 68 days. That's a 15-day swing in four months. For a wholesaler, that swing is the whole story: the same house that would have gone under contract in under two months in April now sits for closer to ten weeks.
How long are homes sitting on the San Antonio market?
San Antonio homes sat a median of 68 days on market in August 2026, up from a spring low of 53 days in April. That's a meaningful slowdown you can see clearly across the past year.
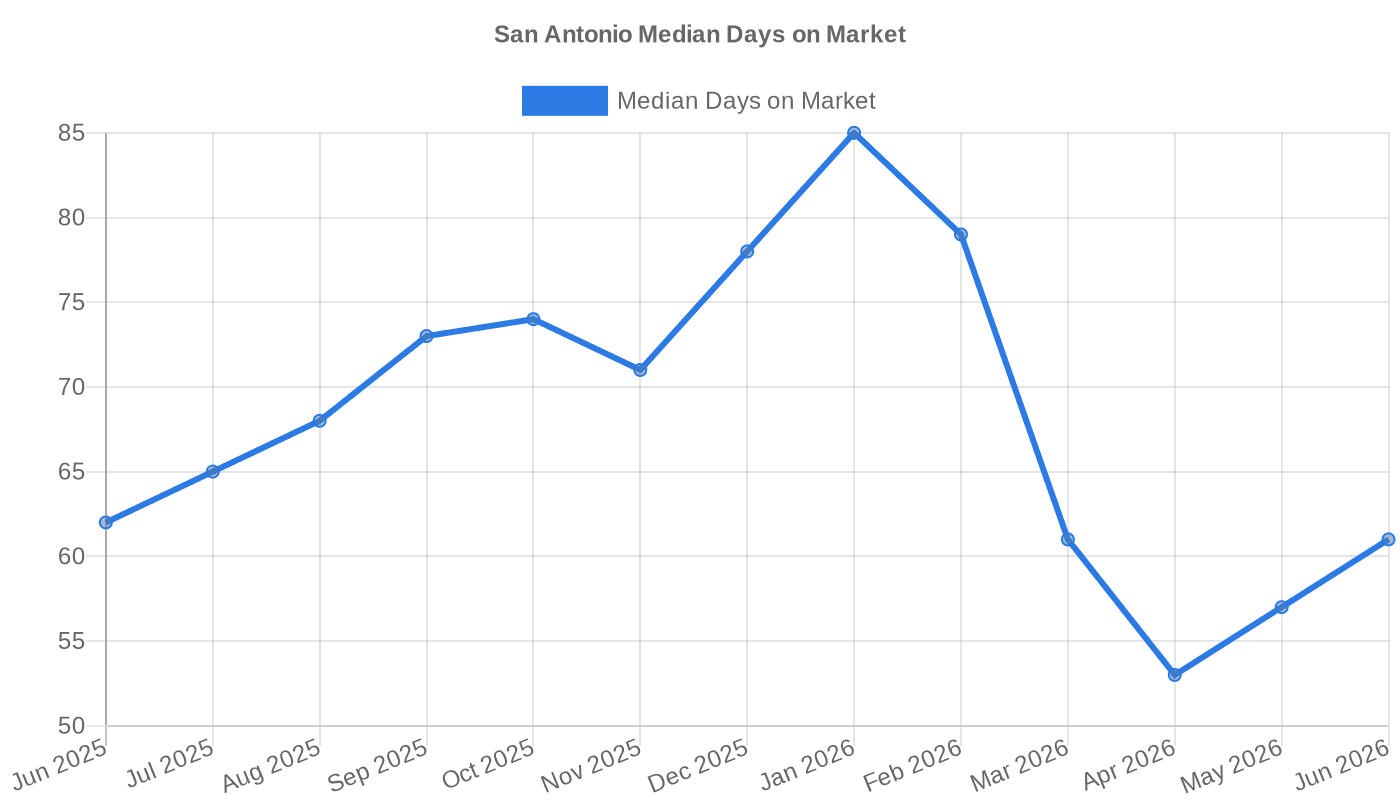
The trend line tells the story in three acts. First, a slow winter: days on market climbed from 68 in August 2025 to a peak of 85 in January 2026. Then a sharp spring thaw: it collapsed to 53 days by April. Then a steady re-cooling: 57 in May, 61 in June, 65 in July, and 68 in August.
That last stretch — four straight months of rising days on market — is the part that matters most right now. Momentum is moving in the seller's direction, and it's moving slowly enough that you have time to work it.
What 68 days means for your acquisition funnel
When homes sit for two months or more, sellers start doing math. They wonder if their price is wrong. They wonder if they should have taken the offer they got in June. That doubt is your opening.
A few practical implications:
- Longer DOM widens your window. You can make a lower, more conservative offer and still have time to negotiate — the seller isn't fielding five competing bids.
- Price cuts become common. When median days on market climbs, list prices usually follow. Watch for reductions and re-engage sellers who said no a month ago.
- Tired landlords surface. A rental owner watching a comparable listing sit for 68 days is more open to a cash offer than they were in April.
How many homes are for sale in San Antonio?
Active listings in San Antonio reached 14,325 in August 2026, the highest level in the past year. Inventory has been building since February and hasn't looked back.
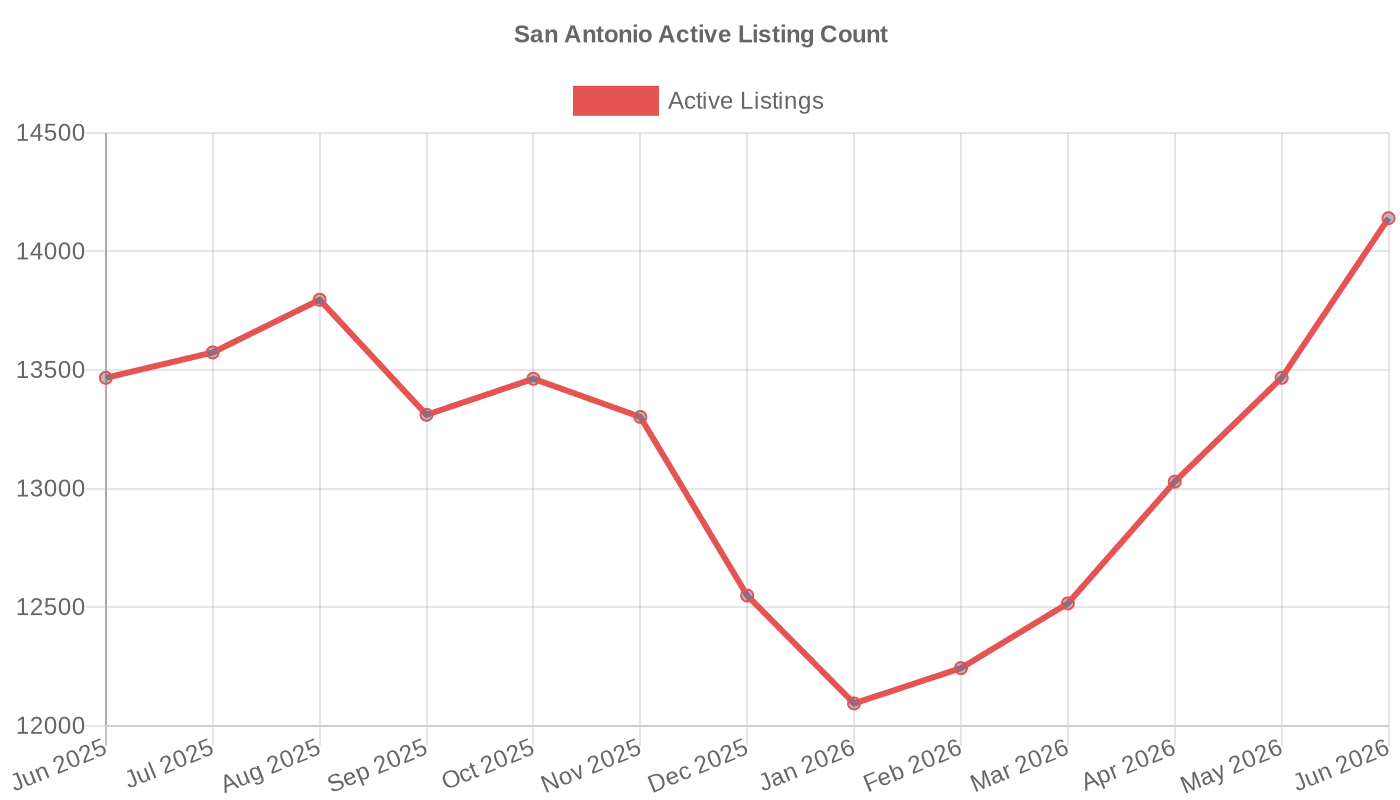
The series shows a clean seasonal arc. Listings bottomed at 12,086 in January 2026, then climbed every month except a small dip in February: 12,238 in February, 12,513 in March, 13,022 in April, 13,463 in May, 14,140 in June, 14,217 in July, and 14,325 in August.
That's roughly 2,200 more active listings than at the start of the year. More inventory means more sellers competing for the same pool of buyers — and fewer buyers means more flexibility on price.
Why rising inventory is good news for wholesalers
A tight market is a wholesaler's enemy. When inventory is scarce, sellers hold firm and buyers overpay. When inventory builds, the leverage shifts.
Here's what to do with 14,325 active listings:
- Pull expired and withdrawn listings weekly. Sellers who couldn't move at 68 days are prime candidates for a cash offer.
- Track price reductions. A second or third price cut usually signals a seller who's ready to talk.
- Watch the rental market. Owners with vacant units in a slower sales market often pivot to selling.
- Build a follow-up cadence. A seller who says no in September may say yes in November when the home still hasn't moved.
Is the San Antonio market slowing or stabilizing?
San Antonio is slowing, not crashing. Days on market is back to where it was a year ago, inventory is up modestly, and prices have eased about 2% year over year. That's a normalizing market, not a distressed one.
Here's the year-over-year comparison:
| Metric | August 2025 | August 2026 | Change |
|---|---|---|---|
| Median days on market | 68 days | 68 days | Flat |
| Active listings | 13,794 | 14,325 | +531 |
| Median listing price | $330,000 | $324,000 | −$6,000 |
Read that table carefully. Days on market is flat year over year — the market isn't dramatically slower than last August. What changed is inventory (up) and price (down). Sellers are listing more and asking less.
The national backdrop
Nationally, median days on market was 60 days in August 2026, down from 73 days in December 2025. San Antonio's 68 days runs about eight days slower than the national figure.
That gap matters. It tells you San Antonio is a slightly softer market than the country as a whole — more room to negotiate, more patient sellers, more deals that need a creative buyer.
How are mortgage rates affecting the San Antonio market?
The 30-year fixed mortgage rate climbed to 7.03% by September 24, 2026, up from 6.43% in early July. That's a 60-basis-point jump in under three months, and it's the single biggest headwind for retail buyers right now.
Watch the trajectory: 6.43% on July 2, 6.66% by July 30, a brief plateau around 6.65% in mid-August, then a steady climb to 6.95% on September 17 and 7.03% on September 24. Rates are moving in one direction, and it's up.
What higher rates mean for your offers
When rates rise, two things happen at once. Buyers can afford less, and sellers get nervous.
- Buyer purchasing power drops. At 7.03%, a buyer who could afford a $350,000 home in July can now afford meaningfully less. That pushes some retail buyers out of the market entirely.
- Seller urgency rises. A seller who was holding out for a retail buyer in June may be rethinking that strategy by October.
- Your cash offer gets more attractive. No financing contingency, no rate risk, no appraisal drama. In a 7% rate environment, certainty is worth real money.
Nationally, the median sales price of houses sold was $410,700 as of April 2026, down from $416,100 a year earlier. Prices are softening across the country, and San Antonio is part of that trend.
What should San Antonio wholesalers do this fall?
San Antonio wholesalers should lean into the slowdown: target expired listings, follow up on price cuts, and lead with certainty instead of price. The market is giving you more motivated sellers than it did in April — the work is in finding and reaching them.
Here's a practical playbook for the next 60 days:
- Build a daily expired-listings list. With 14,325 active listings and 68 median days on market, expirations are climbing. Pull them every morning.
- Segment by time on market. Anything past 60 days is a warm lead. Past 90 days is a hot one.
- Lead with speed and certainty. In a 7.03% rate market, "I can close in 14 days, no financing" beats "I'll pay top dollar" every time.
- Re-run your comps monthly. With list prices drifting down, a comp from June may be stale by October.
- Track your outreach like a pipeline. More inventory means more leads — and more leads means you need a system, not a spreadsheet.
Tools that help you work a slower market
A slower market rewards organization. When you're juggling hundreds of expired listings, price-cut alerts, and follow-ups, the tools you use matter.
Our directory tracks 65 software tools across 9 categories built for real estate investors. A few that fit this exact playbook:
- PropStream — pull expired and pre-foreclosure lists by zip code.
- ATTOM Data — property and ownership data for comping and skip tracing.
- CallTools — dialer for working large lead lists efficiently.
- Launch Control — CRM built for wholesalers managing follow-up cadences.
- GoHighLevel — all-in-one CRM and marketing automation.
- Televista Lead Generation — lead gen support when you need more at-bats.
You can compare all of them side by side in the directory before you commit to a subscription.
Practice the calls before you make them
More leads only helps if you can convert them. A seller at 68 days on market is often emotional, tired, and skeptical of investors.
If your phone skills feel rusty, try our free AI Cold Call Trainer. You practice against a realistic AI seller — no signup, no cost — so your first real call of the day isn't your first rep.
The Bottom Line
San Antonio's market is cooling in all the right ways for wholesalers: 68 median days on market, 14,325 active listings, a $324,000 median list price, and mortgage rates at 7.03%. That's more motivated sellers, more negotiating room, and more time to work each deal.
The one next step: pick two or three tools from the directory that match your weakest link — lead sourcing, dialing, or follow-up — and compare them head to head this week. Then get on the phone.
Frequently Asked Questions
How long are homes sitting on the market in San Antonio right now?
San Antonio homes had a median of 68 days on market as of August 2026. That's flat versus August 2025 but up from a spring low of 53 days in April 2026.
How many homes are for sale in San Antonio?
There were 14,325 active listings in San Antonio as of August 2026 — the highest count in the past year and up from 12,086 in January 2026.
What is the median listing price in San Antonio?
The median listing price in San Antonio was $324,000 as of August 2026, down from $330,000 a year earlier.
Is the San Antonio real estate market slowing down?
It's cooling, not crashing. Days on market is flat year over year, but inventory is up and list prices have eased about 2%. That points to a normalizing market rather than a distressed one.
How do mortgage rates affect San Antonio wholesalers?
The 30-year fixed rate rose to 7.03% by September 24, 2026. Higher rates shrink retail buyer budgets, which makes cash offers with no financing contingency more attractive to sellers.
What's the best strategy for wholesaling in San Antonio this fall?
Target expired listings and price cuts, lead with speed and certainty, and follow up consistently. With 68 median days on market and 14,325 active listings, seller motivation is building.
Sources
- San Antonio: Median days on market (as of 2026-08-01) — Realtor.com via FRED
- San Antonio: Active listing count (as of 2026-08-01) — Realtor.com via FRED
- San Antonio: Median listing price (as of 2026-08-01) — Realtor.com via FRED
- Software tools tracked in the Wholesale REI directory — Wholesale REI directory
- Tool categories in the Wholesale REI directory — Wholesale REI directory
- 30-Year Fixed Mortgage Rate (as of 2026-09-24) — FRED (Federal Reserve Bank of St. Louis)
- Median Sales Price of Houses Sold (as of 2026-04-01) — FRED (Federal Reserve Bank of St. Louis)
- Median Days on Market (as of 2026-08-01) — FRED (Federal Reserve Bank of St. Louis)
This article was researched and drafted with AI assistance, then reviewed and edited by Mark Anthony. Every statistic is sourced and cited. It's for informational purposes only and is not financial or legal advice. Read our editorial policy.