Houston Real Estate Market Update — October

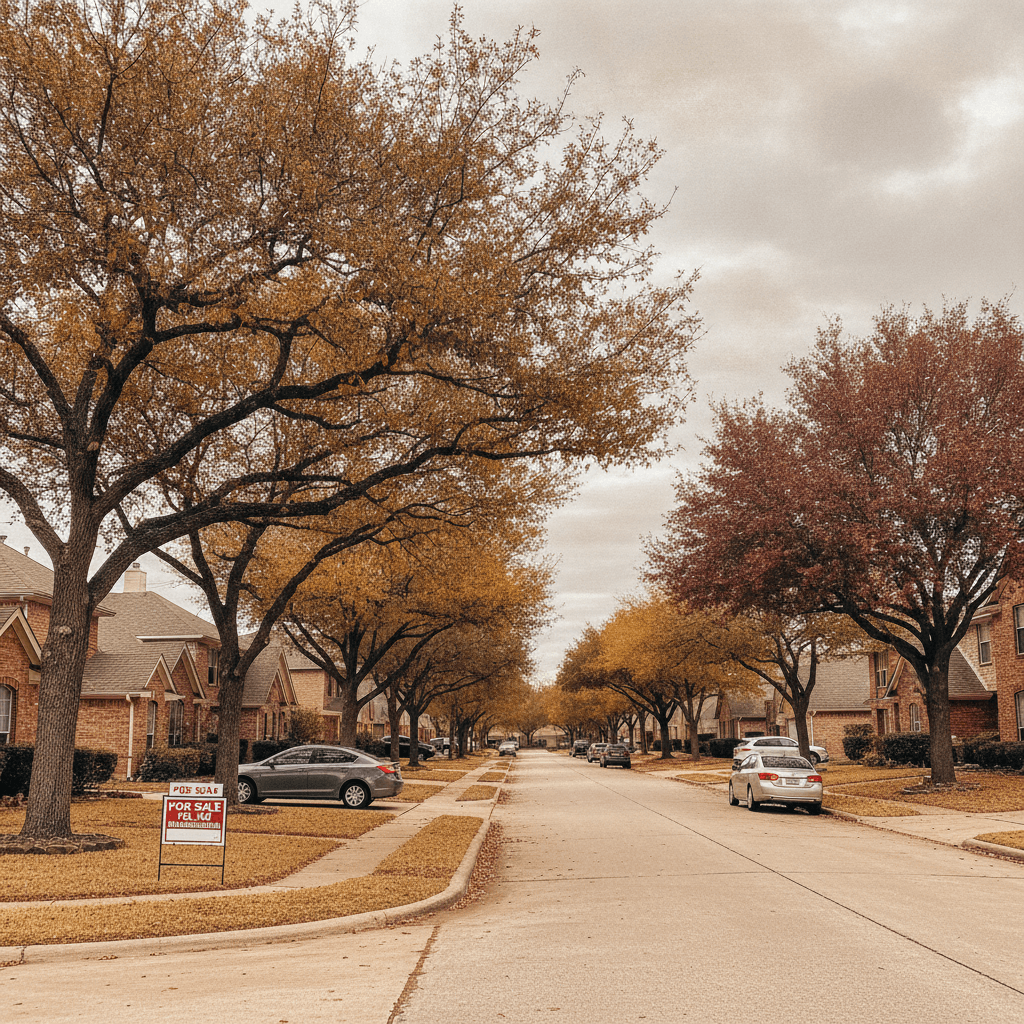
Houston homes are sitting on the market longer than they were a year ago, and there are more of them for sale. If you're wholesaling in the metro, that shift changes how you price offers, how long you hold a contract, and how hard you have to work your buyer list.
Key Takeaways
- Houston's median days on market hit 55 days in September 2026, up from 56 a year earlier but well above the spring low of 48.
- Active listings climbed to 35,898 in September 2026, up from 34,090 in September 2025.
- The median listing price slipped to $353,995, down from $359,950 a year earlier.
- The 30-year fixed mortgage rate jumped to 7.32% as of October 22, 2026, up from 6.66% in late July — that's the number squeezing your buyers.
- Houston homes are moving slightly faster than the national median of 61 days, which gives local wholesalers a small edge on exit speed.
What is happening in the Houston real estate market right now?
Houston's market is cooling at the edges but not collapsing. Inventory is up, prices are down slightly year over year, and days on market have drifted higher since spring.
Here's the September 2026 snapshot from Realtor.com data tracked by FRED:
| Metric | September 2026 | September 2025 | Change |
|---|---|---|---|
| Median days on market | 55 days | 56 days | -1 day |
| Active listing count | 35,898 | 34,090 | +1,808 |
| Median listing price | $353,995 | $359,950 | -$5,955 |
That table tells a simple story. More homes for sale, slightly cheaper asking prices, and roughly the same time to sell as last fall. But the year-over-year comparison hides the real story, which is what happened between January and September.
The spring was fast. Fall is not.
Houston's median days on market bottomed out at 48 days in April 2026. By September it had climbed back to 55.
That's a 7-day swing in five months. For a wholesaler, seven extra days on market means seven more days of carrying costs, holding risk, and buyer hesitation on every deal you assign.

Notice the winter spike too. Days on market hit 66 in January 2026 before the spring thaw. That's normal seasonality in Houston, but it's a reminder that if you're closing deals in December and January, your exit timeline needs more cushion.
Inventory is the bigger story
Active listings bottomed at 29,702 in January 2026 and have climbed every month since, hitting 35,898 in September. That's a 6,196-listing jump in eight months.

More inventory cuts two ways for you. Sellers have more competition, which means more motivated sellers calling you. But your cash buyers also have more retail options, which means they'll be pickier about the deals you bring them.
Why are Houston home prices softening?
The median listing price fell to $353,995 in September 2026, down from $359,950 in September 2025. Prices peaked at $362,265 in June and have slid since.
That's a modest decline — about 1.7% year over year. But direction matters more than size when you're negotiating.
What the price trend means for your offers
When list prices are drifting down, sellers who priced in June are now overpriced. Those are your best leads.
Look at the monthly path:
- January 2026: $349,900
- April 2026: $359,897
- June 2026: $362,265 (peak)
- September 2026: $353,995
A seller who listed in June at the market median is now chasing a market that's dropped roughly $8,270 in three months. That gap is where wholesale profit lives — if you can move fast.
How is the mortgage rate affecting Houston buyers?
The 30-year fixed rate hit 7.32% as of October 22, 2026, up sharply from 6.66% at the end of July. That's a 66-basis-point jump in under three months.

This is the single most important number in this update for your business. Every rate hike prices another batch of retail buyers out of the market.
What a 7.32% rate does to your buyer list
Your cash buyers and hard money buyers don't care much about the 30-year rate. Your end buyers — the owner-occupants and small landlords who buy your assigned contracts — care a lot.
At 7.32%, a buyer financing $300,000 pays meaningfully more per month than they did in July. Some of them drop out. The ones who stay negotiate harder.
Practical moves right now:
- Re-verify your buyer list this week. Anyone who was pre-approved in July needs a fresh check.
- Lean on cash buyers. They're rate-insensitive and close faster in a 55-day market.
- Price assignments for the financing buyer's new math. If your spread only worked at 6.66%, it doesn't work now.
How does Houston compare to the national market?
Houston is moving slightly faster than the country as a whole. The national median days on market was 61 in September 2026, versus Houston's 55.
That six-day gap is real but small. It means Houston inventory is absorbing a bit better than the national average, even as local listings climb.
The national price picture
The national median sales price of houses sold was $393,300 as of July 1, 2026, down from $410,100 a year earlier. That's a national decline of about 4.1%.
Houston's listing price decline of roughly 1.7% is milder. So Houston is holding up better than the national average on price, even while inventory builds.
What that means for you: don't panic-price your deals based on national headlines. Houston is softer than it was in spring, but it's not a distressed market.
What should wholesalers do differently in this Houston market?
Adjust three things: your offer math, your marketing speed, and your buyer follow-up. The market hasn't flipped to a buyer's paradise, but the leverage has shifted.
1. Rebuild your offer formula around 55 days
If your deals assume a 30-day exit, you're modeling a market that doesn't exist right now. Houston's median is 55 days.
Use 55 days as your baseline and add a buffer for winter. Days on market hit 66 in January 2026. If you're contracting in November, model 65+ days, not 55.
2. Target the overpriced listings
With the median list price down from its June peak, sellers who listed high are now stuck. Those are your highest-probability conversations.
Pull expired and price-reduced listings weekly. In a market with 35,898 active listings, there's no shortage of candidates — the work is filtering fast enough to call them before someone else does.
3. Speed up your outreach
More inventory means more competition for the same motivated seller's attention. The wholesaler who calls first wins more often than the one with the better script.
This is where your stack matters. A CRM that triggers dialing campaigns automatically beats a spreadsheet every time. If you're comparing options, the directory tracks 65 tools across 9 categories, so you can match your budget to your volume instead of guessing.
4. Tighten your buyer list
With rates at 7.32%, your financing buyers are wobbling. Segment your list into cash buyers and financed buyers, and lead with cash on every assignment.
A simple weekly check-in with your top 10 cash buyers will do more for your close rate than another 500 cold emails.
What is the outlook for the rest of 2026?
Expect more inventory and slower days on market through year-end, based on the seasonal pattern already showing in the data. Houston's listings climbed every month from January through September, and days on market rose from 48 in April to 55 in September.
The rate picture is the wildcard. Rates jumped from 6.66% in late July to 7.32% by late October. If that trend continues, expect more retail buyers to pause and more sellers to get flexible.
For wholesalers, flexibility from sellers is good news. It's the raw material of a good assignment.
The Bottom Line
Houston's market in October 2026 is softer but not broken: 35,898 active listings, 55 median days on market, and a median list price of $353,995. The rate jump to 7.32% is the number to watch, because it decides how many of your end buyers can actually close. Before you make your next round of seller calls, practice a few against a realistic AI seller with our free AI Cold Call Trainer — it takes no signup to start.
Frequently Asked Questions
How many days does it take to sell a home in Houston right now?
The median Houston home spent 55 days on market in September 2026, according to Realtor.com data tracked by FRED. That's slightly faster than the national median of 61 days.
How many homes are for sale in Houston in October 2026?
There were 35,898 active listings in Houston as of September 2026, up from 34,090 a year earlier. Inventory has climbed every month since January 2026.
What is the median listing price in Houston?
The median listing price in Houston was $353,995 in September 2026, down from $359,950 a year earlier and below the June 2026 peak of $362,265.
What is the mortgage rate doing to the Houston market?
The 30-year fixed rate rose to 7.32% as of October 22, 2026, up from 6.66% in late July. Higher rates price out some financed buyers, which makes cash buyers more valuable to wholesalers.
Is now a good time to wholesale in Houston?
It can be, if you adjust your offer math. More inventory and softening list prices create motivated sellers, but a 55-day median market and 7.32% rates mean you need a longer exit timeline and a cash-heavy buyer list.
How does Houston compare to the national housing market?
Houston homes sell a bit faster than the national median (55 days versus 61), and local list prices have fallen less than the national median sales price, which dropped to $393,300 as of July 2026.
Sources
- Houston: Median days on market (as of 2026-09-01) — Realtor.com via FRED
- Houston: Active listing count (as of 2026-09-01) — Realtor.com via FRED
- Houston: Median listing price (as of 2026-09-01) — Realtor.com via FRED
- 30-Year Fixed Mortgage Rate (as of 2026-10-22) — FRED (Federal Reserve Bank of St. Louis)
- Median Sales Price of Houses Sold (as of 2026-07-01) — FRED (Federal Reserve Bank of St. Louis)
- Median Days on Market (as of 2026-09-01) — FRED (Federal Reserve Bank of St. Louis)
- Software tools tracked in the Wholesale REI directory — Wholesale REI directory
- Tool categories in the Wholesale REI directory — Wholesale REI directory
This article was researched and drafted with AI assistance, then reviewed and edited by Mark Anthony. Every statistic is sourced and cited. It's for informational purposes only and is not financial or legal advice. Read our editorial policy.