Indianapolis Off-Market Deals: 5 Ways to Find Them First

If you're wholesaling in Indianapolis, you've probably noticed homes aren't flying off the market like they did last spring. The latest data shows the median home now sits for 51 days — up from 47 days a year ago — and active listings have climbed to 6,422, giving buyers (and wholesalers) more choices than they've had in months.
Key Takeaways
- Indianapolis homes spend a median of 51 days on the market as of August 2026, up from 47 days a year earlier.
- Active listings have surged to 6,422, a 21% increase from August 2025's 5,316.
- The median listing price sits at $310,000, down from $327,500 a year ago — a sign of a cooling but still active market.
- The 30-year fixed mortgage rate is 6.71% (as of September 3, 2026), keeping some buyers on the sidelines.
- For wholesalers, the sweet spot is distressed or overpriced listings that have been on the market 60+ days — your negotiation leverage is growing.
What is the Indianapolis Real Estate Market Doing Right Now?
The Indianapolis real estate market is cooling from its pandemic-era peak, with homes taking longer to sell and prices easing. As of August 1, 2026, the median days on market is 51 days, active listings total 6,422, and the median listing price is $310,000 (source: Realtor.com via FRED). That's a noticeable shift from a year ago, when homes moved in 47 days and the median list price was $327,500.
This isn't a crash — it's a normalization. Inventory is rising, but it's still below the levels that would signal a buyer's market. For wholesalers, this is a golden window: more inventory means more motivated sellers, and longer days on market means more room to negotiate.
How We Got Here: A 12-Month Look
Let's break down the numbers over the past year to see the trajectory.
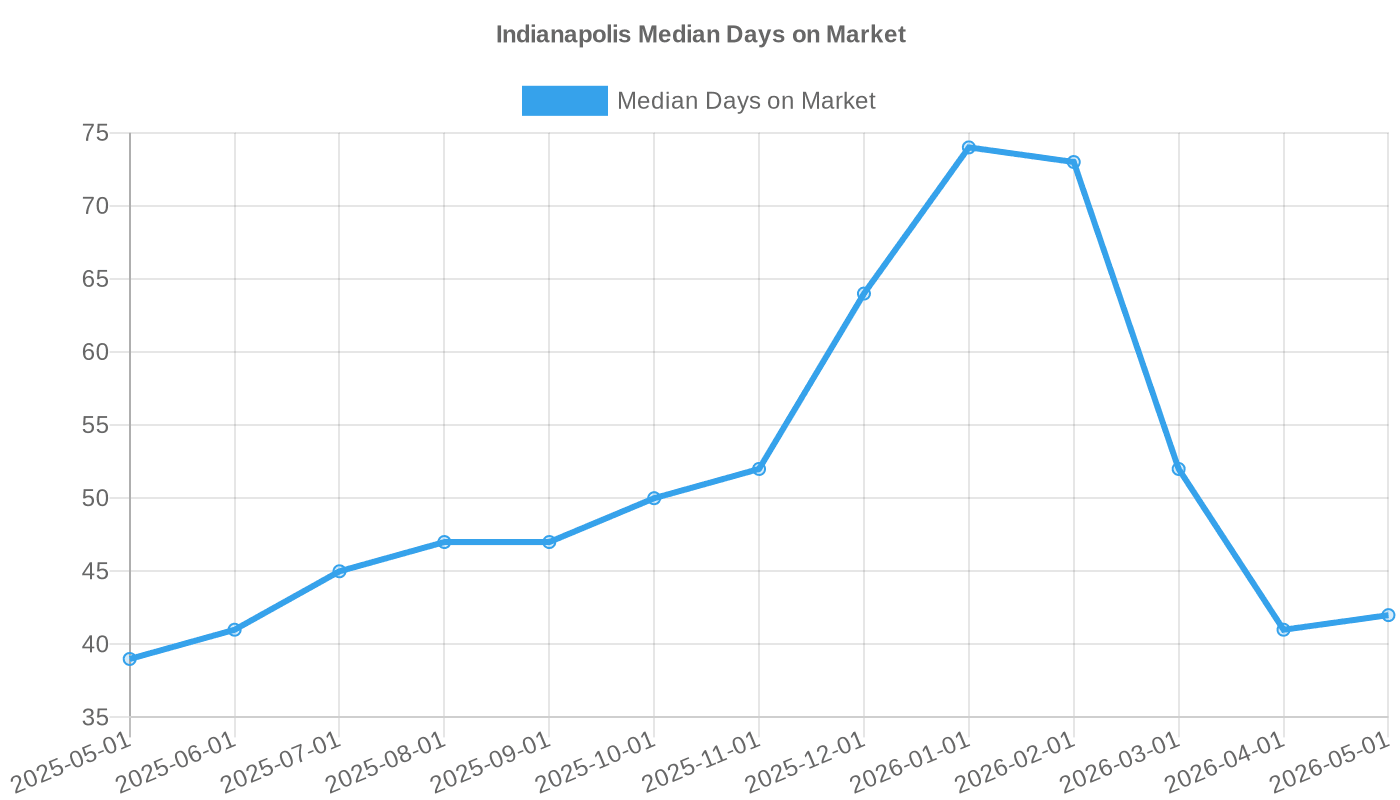
Median Days on Market (Indianapolis)
| Month | Days on Market |
|---|---|
| Aug 2025 | 47 |
| Sep 2025 | 47 |
| Oct 2025 | 50 |
| Nov 2025 | 52 |
| Dec 2025 | 64 |
| Jan 2026 | 74 |
| Feb 2026 | 73 |
| Mar 2026 | 52 |
| Apr 2026 | 41 |
| May 2026 | 42 |
| Jun 2026 | 45 |
| Jul 2026 | 47 |
| Aug 2026 | 51 |
The winter months saw a big jump — homes sat for 74 days in January — but spring brought a burst of activity, dropping to 41 days in April. Since then, the market has slowed again, with August hitting 51 days.
Active Listings (Indianapolis)
| Month | Active Listings |
|---|---|
| Aug 2025 | 5,316 |
| Sep 2025 | 5,730 |
| Oct 2025 | 5,910 |
| Nov 2025 | 5,865 |
| Dec 2025 | 5,185 |
| Jan 2026 | 4,625 |
| Feb 2026 | 4,356 |
| Mar 2026 | 4,427 |
| Apr 2026 | 4,861 |
| May 2026 | 5,255 |
| Jun 2026 | 5,694 |
| Jul 2026 | 6,119 |
| Aug 2026 | 6,422 |
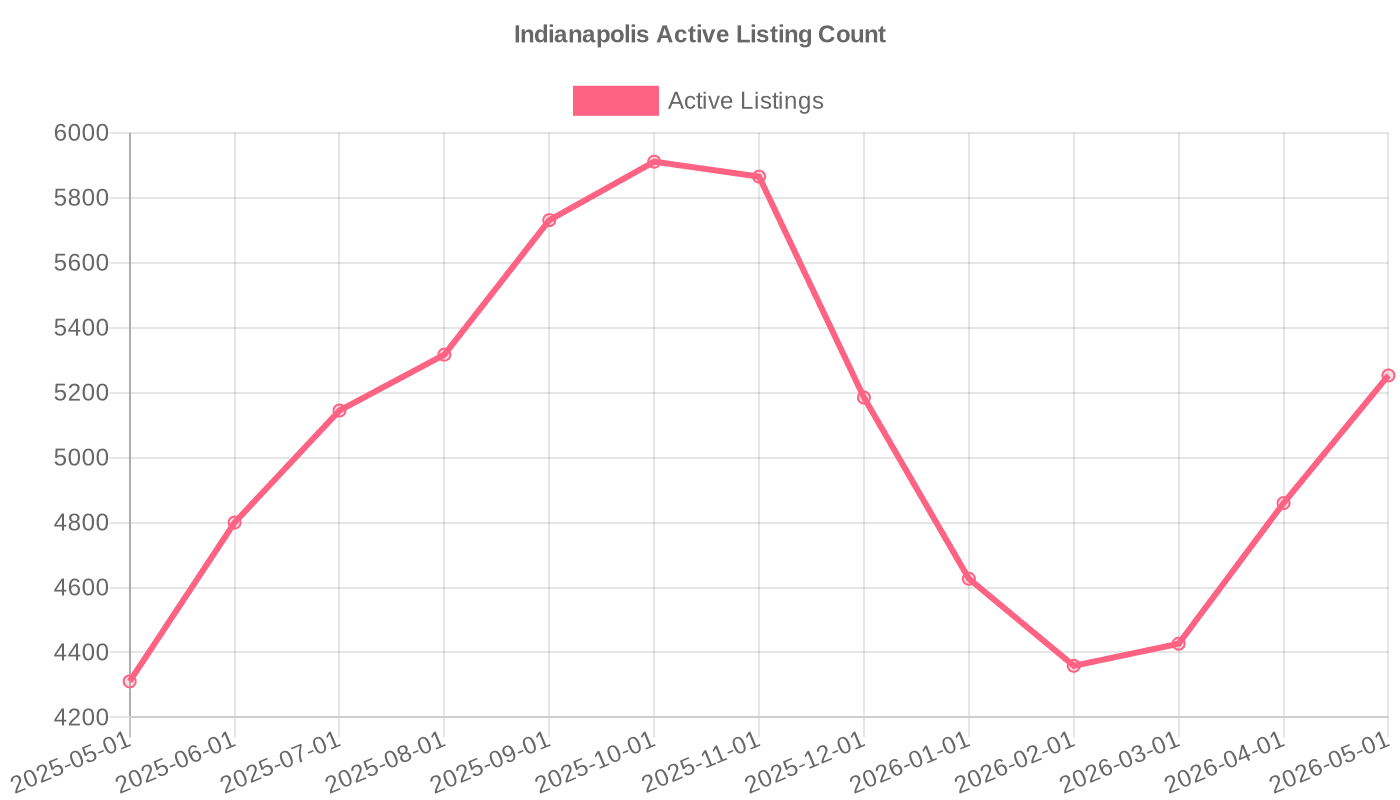
Inventory bottomed out in February at 4,356, then climbed steadily through the summer. August's 6,422 is the highest level in a year.
Median Listing Price (Indianapolis)
| Month | Median List Price |
|---|---|
| Aug 2025 | $327,500 |
| Sep 2025 | $323,250 |
| Oct 2025 | $320,000 |
| Nov 2025 | $315,000 |
| Dec 2025 | $309,974 |
| Jan 2026 | $305,000 |
| Feb 2026 | $309,950 |
| Mar 2026 | $312,500 |
| Apr 2026 | $318,950 |
| May 2026 | $320,000 |
| Jun 2026 | $321,450 |
| Jul 2026 | $315,000 |
| Aug 2026 | $310,000 |
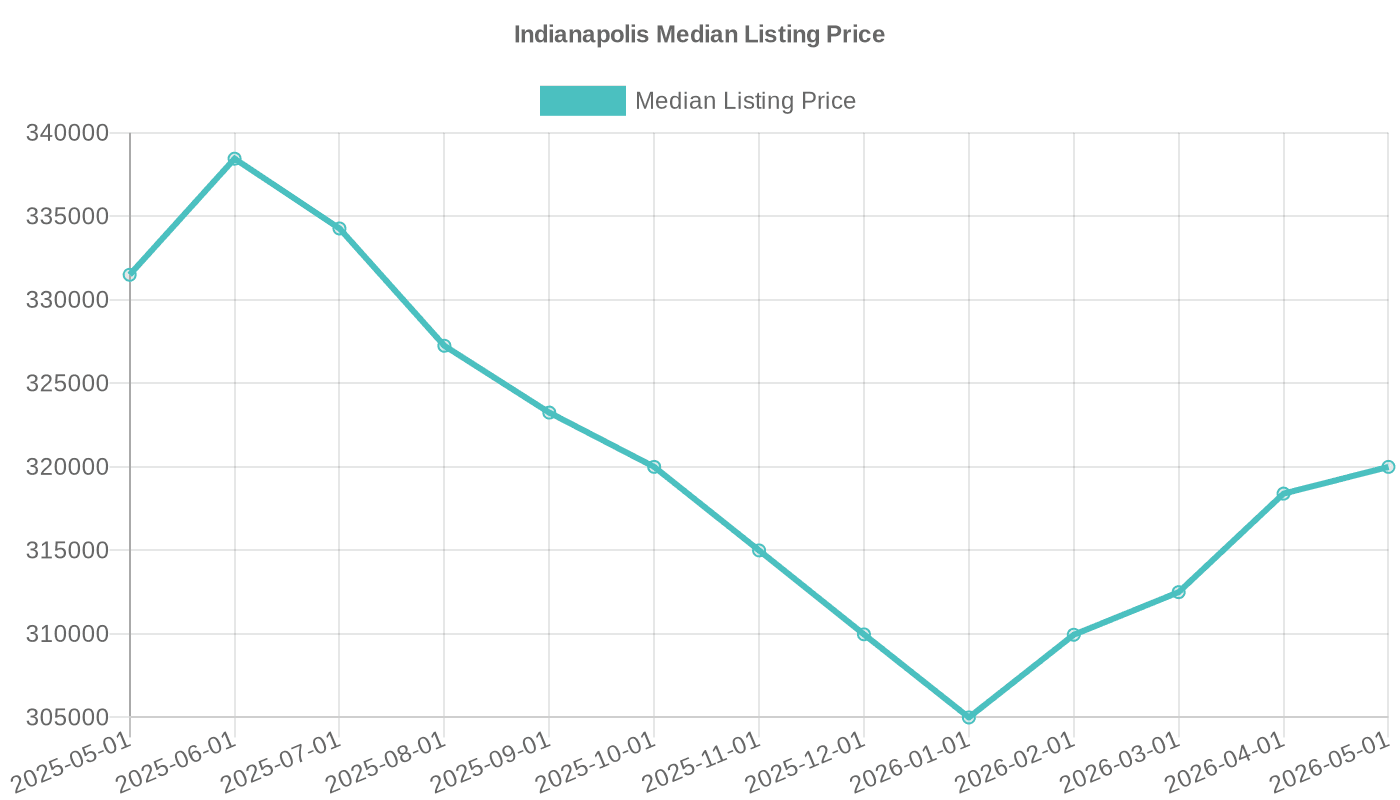
Prices dipped to $305,000 in January, rebounded to $321,450 in June, but have since fallen back to $310,000.
Why Is the Indianapolis Market Cooling?
Several factors are at play, and understanding them helps you predict where things are headed.
Mortgage Rates Are Squeezing Buyers
The 30-year fixed mortgage rate hit 6.71% as of September 3, 2026 (source: FRED). That's up from 6.52% in mid-June. Higher rates mean higher monthly payments, which pushes some buyers out of the market or forces them to lowball offers. For sellers, that translates into longer days on market and more price cuts.
National Trends Mirror Local Ones
Nationally, the median sales price of houses sold was $410,700 as of April 2026 (source: FRED), and the median days on market was 60 days in August 2026 (source: FRED). Indianapolis's 51 days is actually faster than the national average, but the direction is the same: homes are taking longer to sell than they did a year ago.
Seasonal Patterns
Real estate always slows in winter and picks up in spring. But this year, the summer slowdown started earlier than usual. July and August typically see a dip, but the jump from 47 to 51 days between July and August suggests a more pronounced cooling than normal.
How Should Wholesalers Adjust Their Strategy?
If you're wholesaling in Indianapolis, you need to adapt to this new reality. Here's a step-by-step playbook.
1. Target Listings That Have Stalled
Look for homes that have been on the market for 60 days or more. These sellers are getting anxious, especially if they've already cut the price once. Use the days-on-market data to filter your leads.
2. Sharpen Your Negotiation Script
With more inventory, buyers have options. Your buyer's agent will tell you that your exit price needs to be realistic. When you make an offer, build in a cushion for the buyer's closing costs and potential repairs.
3. Focus on Off-Market Deals
Since the MLS is crowded, your edge is finding motivated sellers who haven't listed yet. Drive for dollars, send direct mail, and build a network of bird dogs who can tip you off to pre-foreclosures or inherited properties.
4. Use the Right Tools
You don't have to do this alone. The Wholesale REI directory tracks 65 software tools across 9 categories (source: Wholesale REI directory). Whether you need skip tracing, CRM, or marketing automation, there's a tool that fits your budget.
5. Practice Your Pitch
Before you call a seller, practice your pitch. You can use our free AI Cold Call Trainer to simulate a conversation with a realistic seller. It's free and takes no signup to start. This helps you refine your approach so you sound confident when it counts.
What Does the Data Mean for Wholesalers?
Let's put the numbers in context.
More Inventory = More Opportunities
With 6,422 active listings, you have a larger pool of potential deals. But more inventory also means more competition among wholesalers. You need to be faster and more creative to lock up the best properties.
Longer Days on Market = More Leverage
When a home sits for 51 days, the seller is more likely to accept a below-market offer. Use this to your advantage. A seller who's been waiting two months is far more motivated than one who just listed.
Price Drops = Better Margins
The median list price has dropped from $327,500 to $310,000 over the past year. That's a 5.3% decline. For wholesalers, this means you can potentially acquire properties at lower prices, which improves your spread when you assign the contract.
How Does Indianapolis Compare to the Nation?
To give you perspective, here's a quick comparison.
| Metric | Indianapolis (Aug 2026) | National (Aug 2026) |
|---|---|---|
| Median Days on Market | 51 days | 60 days |
| Active Listings | 6,422 | N/A |
| Median Listing Price | $310,000 | N/A |
| Median Sales Price | N/A | $410,700 (Apr 2026) |
Indianapolis is moving faster than the national average, but the trend is similar: homes are taking longer to sell, and prices are softening.
What's the Outlook for the Rest of 2026?
While no one has a crystal ball, the current data suggests a continued cooling into the fall and winter. Mortgage rates are likely to stay elevated, which will keep some buyers out. Expect days on market to climb further, possibly reaching the mid-60s by December, similar to last year's pattern.
Watch These Indicators
- Mortgage rates: If rates drop below 6%, expect a surge in buyer demand.
- Inventory levels: If active listings continue to rise, sellers will become even more motivated.
- Price trends: Watch for more price cuts as sellers adjust to the new reality.
The Bottom Line
The Indianapolis real estate market is shifting from a seller's market to a more balanced one. Homes are taking longer to sell, prices are easing, and inventory is growing. For wholesalers, this is an opportunity to negotiate better deals and build your pipeline. To stay ahead, compare the latest software tools in the Wholesale REI directory and refine your approach with our free AI Cold Call Trainer — practice a few calls before you hit the phones.
Frequently Asked Questions
What is the current median days on market in Indianapolis?
As of August 1, 2026, the median days on market in Indianapolis is 51 days, up from 47 days a year earlier. This means homes are taking longer to sell, giving buyers and wholesalers more negotiation power.
How many active listings are there in Indianapolis?
There are 6,422 active listings in Indianapolis as of August 1, 2026. This is the highest level in a year, indicating a growing inventory that offers more opportunities for wholesalers to find deals.
What is the median listing price in Indianapolis?
The median listing price in Indianapolis is $310,000 as of August 1, 2026. This is down from $327,500 a year ago, reflecting a cooling market where sellers are adjusting their expectations.
How do mortgage rates affect the Indianapolis market?
The 30-year fixed mortgage rate is 6.71% as of September 3, 2026. Higher rates reduce buyer affordability, which slows demand and contributes to longer days on market and price softening.
What should wholesalers do in a cooling market?
Wholesalers should target listings that have been on the market for 60+ days, focus on off-market deals, and sharpen negotiation skills. Tools like the AI Cold Call Trainer can help practice pitches.
Sources
- Indianapolis: Median days on market (as of 2026-08-01) — Realtor.com via FRED
- Indianapolis: Active listing count (as of 2026-08-01) — Realtor.com via FRED
- Indianapolis: Median listing price (as of 2026-08-01) — Realtor.com via FRED
- 30-Year Fixed Mortgage Rate (as of 2026-09-03) — FRED (Federal Reserve Bank of St. Louis)
- Median Sales Price of Houses Sold (as of 2026-04-01) — FRED (Federal Reserve Bank of St. Louis)
- Median Days on Market (as of 2026-08-01) — FRED (Federal Reserve Bank of St. Louis)
- Software tools tracked in the Wholesale REI directory — Wholesale REI directory
- Tool categories in the Wholesale REI directory — Wholesale REI directory
This article was researched and drafted with AI assistance, then reviewed and edited by Mark Anthony. Every statistic is sourced and cited. It's for informational purposes only and is not financial or legal advice. Read our editorial policy.