Phoenix Real Estate Market Update — October

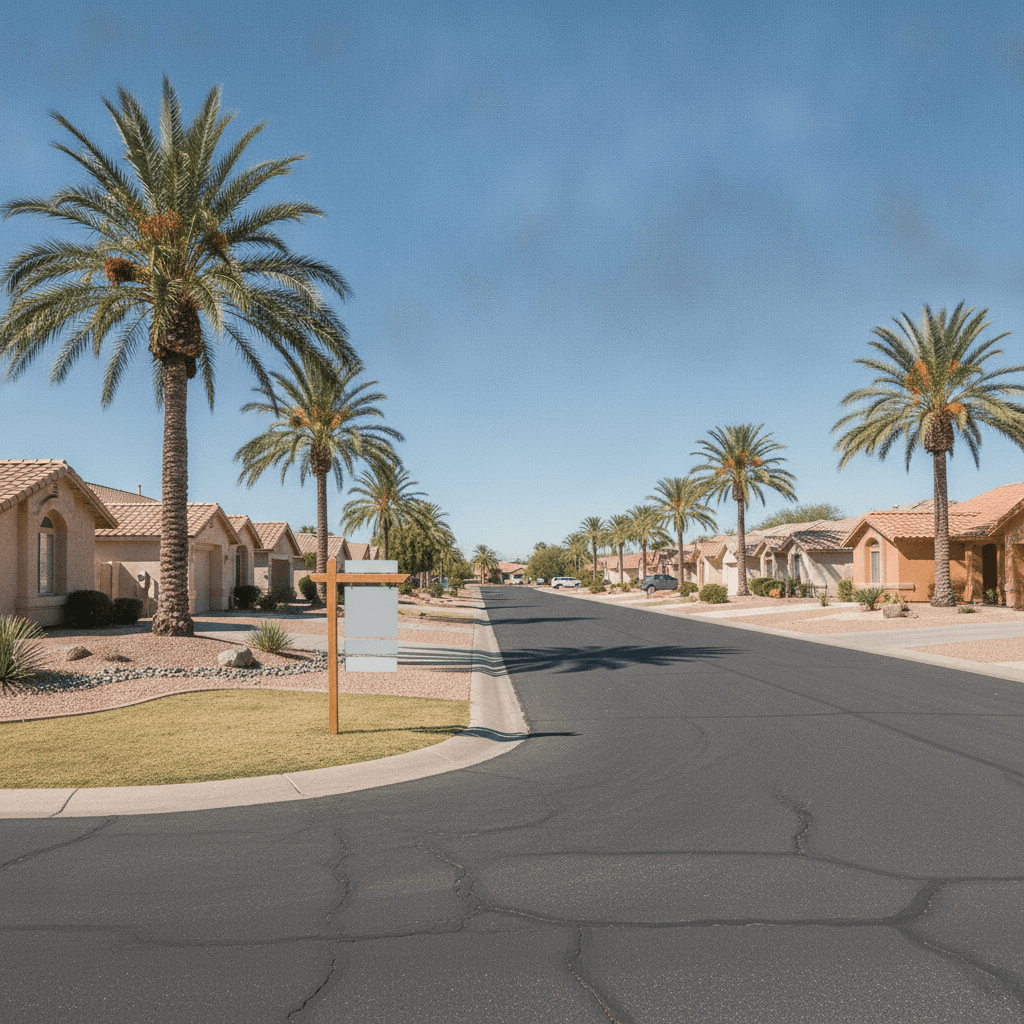
Phoenix homes are taking longer to sell and sellers are cutting prices — and that's exactly the window wholesalers wait for. If you're sourcing deals in the Valley right now, the October 2026 numbers tell a clear story: more inventory, softer prices, and motivated sellers.
Key Takeaways
- Phoenix's median days on market hit 62 days in September 2026 — up from 55 in the spring.
- Active listings climbed to 18,437, giving buyers more choices and sellers more competition.
- The median listing price fell to $475,000, down from $499,000 a year earlier.
- The 30-year fixed mortgage rate jumped to 7.24% by late October, squeezing affordability.
- Nationally, median days on market sits at 61 — Phoenix is now tracking right alongside the U.S. average.
What is the Phoenix real estate market doing right now?
The Phoenix real estate market is cooling into a balanced-to-buyer's market: homes are staying listed longer, inventory is rising, and list prices are softening. As of September 2026, the median days on market was 62 days, active listings totaled 18,437, and the median listing price was $475,000.
That's a meaningful shift from a year ago. In September 2025, Phoenix homes were selling in a median of 65 days — so the timeline hasn't exploded, but the trend through 2026 shows sellers losing leverage. The bigger signal is price: list prices have dropped $24,000 from September 2025 to September 2026.
For wholesalers, this is the environment where distressed and tired sellers start taking calls. When a home sits for two months and the list price gets cut, the seller's motivation rises. That's your entry point.
How does Phoenix compare to the national market?
Phoenix is no longer an outlier — it's moving in step with the country. The U.S. median days on market was 61 in September 2026, just one day faster than Phoenix's 62. A year ago, Phoenix was slightly slower than the national pace, but the gap has essentially closed.
What does that mean for you? You can't rely on "Phoenix is hotter than everywhere else" as a marketing angle anymore. You need to compete on lead quality and speed to contract, not on market hype.
How long are homes sitting on the market in Phoenix?
Homes in Phoenix are sitting for a median of 62 days as of September 2026 — about two months from listing to contract. That's up from 55 days in February and March 2026, when the market briefly tightened.
Here's the full trend over the past year:

The pattern is telling. Days on market dipped to 55 in early 2026, then climbed steadily through the summer to 67 in July and August before easing to 62 in September. That late-summer spike is when seller fatigue sets in — and when wholesale conversations get easier.
Why does days on market matter for wholesalers?
Days on market is your best early-warning signal for motivated sellers. When the median crosses 60 days, a growing share of listings are stale. Those sellers are more open to creative offers, subject-to deals, and assignment contracts.
Use it as a filter in your lead scoring. If a property has been listed for 45+ days and the price has been cut, it moves to the top of your call list.
How many homes are for sale in Phoenix?
There were 18,437 active listings in Phoenix as of September 2026. That's up from 17,144 a year earlier — roughly 1,300 more homes competing for buyers.
Inventory peaked in April 2026 at 19,949 listings before easing through the summer. The September uptick suggests sellers are still coming to market even as buyer demand softens.
What does rising inventory mean for your deals?
More inventory means more competition for sellers — and more sellers willing to negotiate. But it also means your buyers (fix-and-flippers and landlords) have more retail options, so your assignment fees need to be realistic.
A good rule of thumb: if you're wholesaling in a submarket with above-average inventory, price your assignment fee conservatively and focus on speed of close. Buyers pay for certainty when the market is loose.
What is the median listing price in Phoenix?
The median listing price in Phoenix was $475,000 in September 2026. That's down from $499,000 in September 2025 — a $24,000 drop, or roughly 4.8%.
Prices peaked at $499,000 in April 2026 before sliding through the summer. The September figure matches August, suggesting the decline may be flattening.
How does Phoenix pricing compare to the national median sales price?
The national median sales price for houses sold was $393,300 in July 2026 — well below Phoenix's median list price. Phoenix remains a premium market relative to the U.S. as a whole, but the gap is narrowing as local prices soften.
For wholesalers, that means your after-repair value (ARV) comps need to reflect recent sold prices, not last year's list prices. If you're still underwriting at 2025 values, you'll overpay.
How are mortgage rates affecting the Phoenix market?
The 30-year fixed mortgage rate hit 7.24% as of October 29, 2026 — up sharply from 6.65% in late August. That's a nearly 60-basis-point jump in about two months.

Higher rates crush buyer purchasing power. A buyer who could afford a $475,000 home at 6.65% can afford roughly $40,000 less at 7.24%. That pushes more buyers to the sidelines and forces sellers to cut prices — which is exactly what we're seeing in the listing data.
What should wholesalers do when rates spike?
When rates rise, cash buyers and creative-finance buyers become your best customers. Traditional retail buyers drop out, but investors with cash or private money stay active.
Focus your buyer list on:
- Fix-and-flippers with hard money lined up
- Landlords buying for cash flow
- Subject-to and seller-finance buyers who can absorb higher rates
Also, lean into seller-finance and subject-to deals on the acquisition side. Sellers facing a slow market are more open to terms when they understand the alternative is 60+ days on market.
Phoenix market snapshot: September 2026 vs. September 2025
Here's how the key metrics compare year over year:
| Metric | September 2025 | September 2026 | Change |
|---|---|---|---|
| Median days on market | 65 days | 62 days | -3 days |
| Active listings | 17,144 | 18,437 | +1,293 |
| Median listing price | $499,000 | $475,000 | -$24,000 |
| 30-year fixed rate (Oct.) | 6.65% (Aug. 2026 low) | 7.24% (Oct. 29, 2026) | +0.59 pts |
The takeaway: inventory is up, prices are down, and rates are up. That's a seller's problem and a wholesaler's opportunity.
What does this mean for Phoenix wholesalers?
The Phoenix market in October 2026 favors wholesalers who move fast and underwrite conservatively. Sellers are facing longer timelines and lower prices, which opens the door to creative deals.
Here's your action plan:
- Filter leads by days on market. Target listings 45+ days old with at least one price cut.
- Underwrite to current comps. Use September 2026 sold prices, not 2025 list prices.
- Build a cash-buyer list. With rates at 7.24%, your buyers need to be less rate-sensitive.
- Lead with terms. Seller finance and subject-to are easier sells when the alternative is 60+ days on market.
- Track inventory weekly. Rising active listings mean more seller motivation — stay on top of it.
Which software helps you work a shifting market?
You need tools that pull listing data, flag stale listings, and automate follow-up. In the Wholesale REI directory, there are 65 tools across 9 categories — from data platforms like PropStream and ATTOM to CRM and dialer systems like GoHighLevel and CallTools.
Start with a data tool to identify stale listings, then layer in a CRM and dialer to work the leads fast. Speed matters more in a soft market because your competition is also calling the same sellers.
The Bottom Line
Phoenix is shifting in your favor: 62 days on market, 18,437 active listings, and a $475,000 median list price mean sellers are feeling pressure. The wholesalers who win this fall will be the ones with clean data, fast follow-up, and realistic assignment fees.
Your next step: compare data and CRM tools in the directory so you can spot stale listings and reach sellers before anyone else. And when you're ready to practice the conversation, try our free AI Cold Call Trainer — it takes no signup to start.
Frequently Asked Questions
What is the median days on market in Phoenix right now?
As of September 2026, the median days on market in Phoenix is 62 days. That's up from 55 days in early 2026, signaling sellers are facing longer timelines.
How many active listings are there in Phoenix?
There were 18,437 active listings in Phoenix as of September 2026, up from 17,144 a year earlier. Rising inventory gives buyers more choices and sellers more competition.
What is the median listing price in Phoenix?
The median listing price in Phoenix was $475,000 in September 2026, down from $499,000 in September 2025. That's a $24,000 drop year over year.
How are mortgage rates affecting the Phoenix housing market?
The 30-year fixed rate reached 7.24% by late October 2026, up from 6.65% in August. Higher rates reduce buyer purchasing power and push sellers to cut prices, which creates opportunities for cash and creative-finance buyers.
Is now a good time to wholesale real estate in Phoenix?
Yes — softer prices, rising inventory, and longer days on market mean more motivated sellers. Focus on stale listings with price cuts and underwrite to current comps.
What tools help wholesalers in a shifting Phoenix market?
Data platforms like PropStream and ATTOM help you spot stale listings, while CRMs and dialers like GoHighLevel and CallTools help you follow up fast. The Wholesale REI directory tracks 65 tools across 9 categories.
Sources
- Phoenix: Median days on market (as of 2026-09-01) — Realtor.com via FRED
- Phoenix: Active listing count (as of 2026-09-01) — Realtor.com via FRED
- Phoenix: Median listing price (as of 2026-09-01) — Realtor.com via FRED
- Software tools tracked in the Wholesale REI directory — Wholesale REI directory
- Tool categories in the Wholesale REI directory — Wholesale REI directory
- 30-Year Fixed Mortgage Rate (as of 2026-10-29) — FRED (Federal Reserve Bank of St. Louis)
- Median Sales Price of Houses Sold (as of 2026-07-01) — FRED (Federal Reserve Bank of St. Louis)
- Median Days on Market (as of 2026-09-01) — FRED (Federal Reserve Bank of St. Louis)
This article was researched and drafted with AI assistance, then reviewed and edited by Mark Anthony. Every statistic is sourced and cited. It's for informational purposes only and is not financial or legal advice. Read our editorial policy.